Seldon Webinar Notes - ML Monitoring
Written on March 1st , 2022 by Daniel E
In a bid to stay up-to-date with the latest developments in the field of AI, I joined Alejandro Saucedo from Seldon on a webinar where he outlined the principles of efficient monitoring of ML models in production, as well as scaling and some architectural patterns to help achieve those goals.
In this article I refined my webinar notes into a piece of writing that I and others can revisit.
Abstract
They say the lifecycle of a machine learning model only begins once it’s in production. Elements of ML production architectures should include monitoring of service and model performance, outlier detection, concept drift and explainability, along with eventing/alerting infrastructure. We don’t want to introduce monitoring, drift detection and other such modeules for a single model. The aim is understanding architectural patterns so we can develop best practices for our particular business use case. We want to learn how we can make all our ML models scale and thrive at scale. This is essentially where the work of a machine learning engineer starts, as data scientists retreat to focus on providing us with pretrained models…
Introduction
Production ML is made challenging by the following:
- Compliance/legal requirements: changing depending on jurisdiction, governance, accountability framework; domain experts
- The need for specialised hardware for ML to run efficiently: e.g. GPUs and TPUs
- Requirement of reproducibility: ML is not just a stateless microservice. There is complex and probabilistic behaviour given by ML data, binaries, environment, code, dependencies, where unexpected and unwanted changes can be found.
- Complex dependencies: between modules, tools and data, that grow with scale
“…processing of a single datapoint may require stateful metric assessment across multiple hops, potentially introducing additional layers of domain-specific abstraction which may have to be taken into consideration for reliable interpretation of monitoring state.”
Tools encountered in Seldon’s demo
The use of some of these tools is abstracting common practices from software engineering.
- KNative for eventing - enables ML models to forward the IO of the model into the more advanced ML monitoring components like outlier detectors, concept drift detectors.
- Elasticsearch for logs (all) — “a popular search and analytics engine. It provides extremely scalable search capabilities by taking unstructured data types from various sources and storing them in specialized formats for optimized language-based searches.” Elasticsearch also features RESTful API. Featuring a document key-value store that is commonly used to store the logs from containers, which can then be used to diagnose errors through stack traces or information logs. In the case of machine learning we don’t only use it to store logs but also to store pre-processed inputs and outputs of machine learning models for further processing.
- Prometheus for metrics — A time-series store that is commonly used to store real-time metrics data, which can then be visusalised leveraging tools like Grafana
The Seldon Demo
This webinar really focuses on the Seldon Core and Alibi as products integrating these modules I’m about to list, but I’m not going to go in depth with the proprietary software. It is common to start with a data scientist pre-trained model artifact, that one would pickle to a binary file, then upload it to a Google/S3 bucket, from where we can deploy it. It would need to be containerised, by converting the binaries and other custom code to microservice/JSON-remote procedure call/REST and deployed… Seldon Core (used to showcase the process) has an interface that interacts with an underlying engine that orchestrates models/modules. As part of this interface, you can deploy this artefact and pick parameters such as autoscaling, no of reqs, preprocessing transformers…
This is where we start encountering modules like
- serverless eventing, where an inference request (made by a model) is routed via a cloud-event KNative infra to monitoring components as well as Elasticsearch (stores historical data for further analysis)
- statistical monitoring, where data science specific monitoring takes place: Stateful insights like precision, recall, RMSE, KLDiv etc. Here benchmarking against other models and versions also takes place. At this component there is also talk of facilitating label annotating by domain-experts, through asynchronous architectures.
- outlier/drift detection, an architecture that detects and flags the two both in real time as well as historically. With use of logging/eventing/alerting the data extracted from this module can be used to improve model code, like input validation. Both these would have to be trained and deployed like the main ML model.
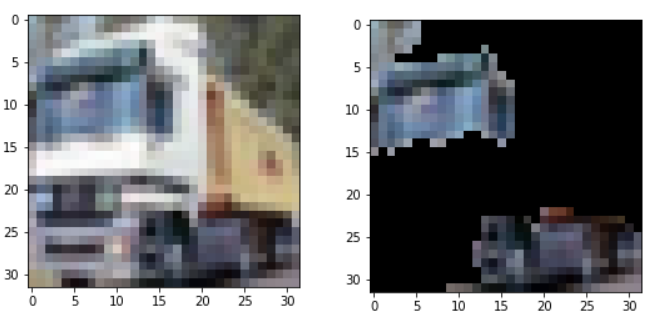
- explainer server, another separate microservice that would interact with the model producing the prediction and “reverse engineer” its decision process. Requires interacting with the data that the ML model processes, as well as the ability to interact with the model itself. For the picture below, this module would show that when a CNN predicts the image on the left to be a truck, it would be the features/areas on the right that make that prediction a truck.
When developing these modules, many factors must be taken into account so that the individual modules can integrate together seamlessly and allow the productionised end result to be robust and scalable. Making them separate already achieves that to some extent.
One must also know why these modules are needed, and the individual complexities each one introduces. E.g. an outlier detector that is deployed may come with similar complexities to the ones from a machine learning model, so it’s important that the same concepts of compliance, governance and lineage are covered with these advanced components.
For these modules, there are a range of different techniques available. Picking the best one for a particular use case depends on its:
- Scope (local vs global)
- Model type (black vs white box)
- Task (classification, regression, etc)
- Data type (tabular, images, text, etc)
- Insight (feature attributions, counterfactuals, influential training instances, etc) _________
Keywords
notes, data-science, drift, outliers, architectures, cloud, statistical, explainability
More to learn about:
- Service level objectives
- [Outliers: What they look like and methods for detection] (https://towardsdatascience.com/a-brief-overview-of-outlier-detection-techniques-1e0b2c19e561)
- Statistical methods for concept drift detection
- KNative Eventing
- Alibi Explain library (open source drift detection algorithms): Library for explainability at Seldon started as research piece code. Now getting a lot of interest in industry. Now wrapped with an interface. Scikitlearn like. Extensive documentation. You choose a scenario and youm may or may not have to fit it w a dataset. Then simply hit explain.